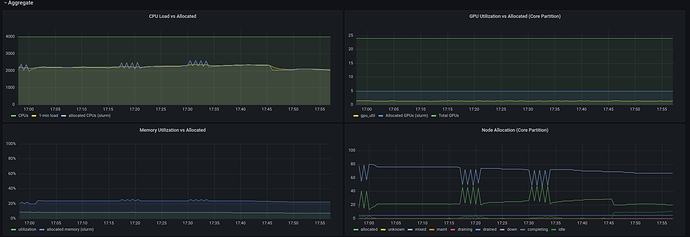
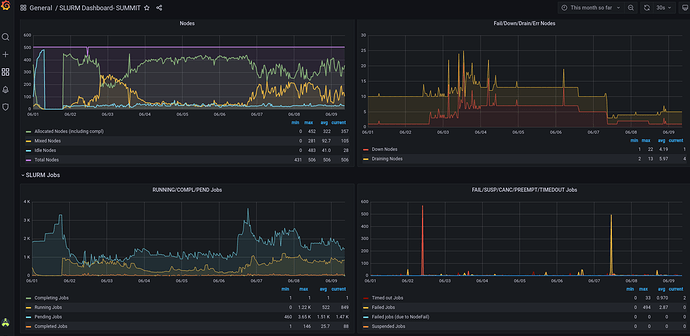
Is anyone using Prometheus and Grafana to collect and display Slurm statistics on their HPC cluster?
We have a graphite+grafana setup where we collect slurm data. We gather the slurm metrics with slurm_exporter.py which we adapted from a slurm.py script made by stanford-rc.
We looked into a prometheus+grafana setup last year but liked the ability to downsample in graphite for 2 year long data retention times.
Edit: included screenshots
I have set up a proof of concept system but haven’t gotten much buy in from my own co-workers.
It is an internal only web service. I could post some screenshots.
Do you have a link so I can see what it looks like?
Thanks, Ed
Sure, that would be useful.


