Setting up a Standalone Installation of MaDDash Using the Package Manager.
Introduction: This document provides instructions on how to set up a MaDDash server to collect information from multiple perfSONAR nodes. This document is primarily intended for network administrators or more advanced users with several perfSONAR nodes who wish to monitor these nodes.
Requirements:
- A Linux computer (CentOS 7) with an internet connection and public IP address
- A super-user account on the computer
CentOS Package Install
Installing the Software
- Start by configuring yum. Run the following commands.
sudo yum install epel-release
sudo yum install http://software.internet2.edu/rpms/el7/x86_64/latest/packages/perfSONAR-repo-0.10-1.noarch.rpm
sudo yum clean all
- Disable Security-Enhanced Linux features (SELinux) using:
sudo setenforce 0
a. Confirm that SELinux is disabled by running
sed -i -e 's/^SELINUX=enforcing/SELINUX=permissive/' /etc/selinux/config
b. The above step is important since SELinux can potentially interfere with the instillation of the perfSONAR toolkits
3. Install the perfSONAR central management bundle.
sudo yum install perfsonar-centralmanagement
a. Enter “y” whenever prompted.
Post-Install Configuration
- Configure the firewall and open ports 80 and 443 using:
sudo firewall-cmd --permanent --add-port=80/tcp
sudo firewall-cmd --permanent --add-port=443/tcp
sudo firewall-cmd --reload
- Configure an admin account for the webUI by running the following command
a. You will be prompted for a password. Make sure to pick a strong password.
sudo htpasswd /etc/maddash/maddash-webui/admin-users maddash-webadmin
- You should now be able to go to “https:///maddash-webui” to access the web UI.
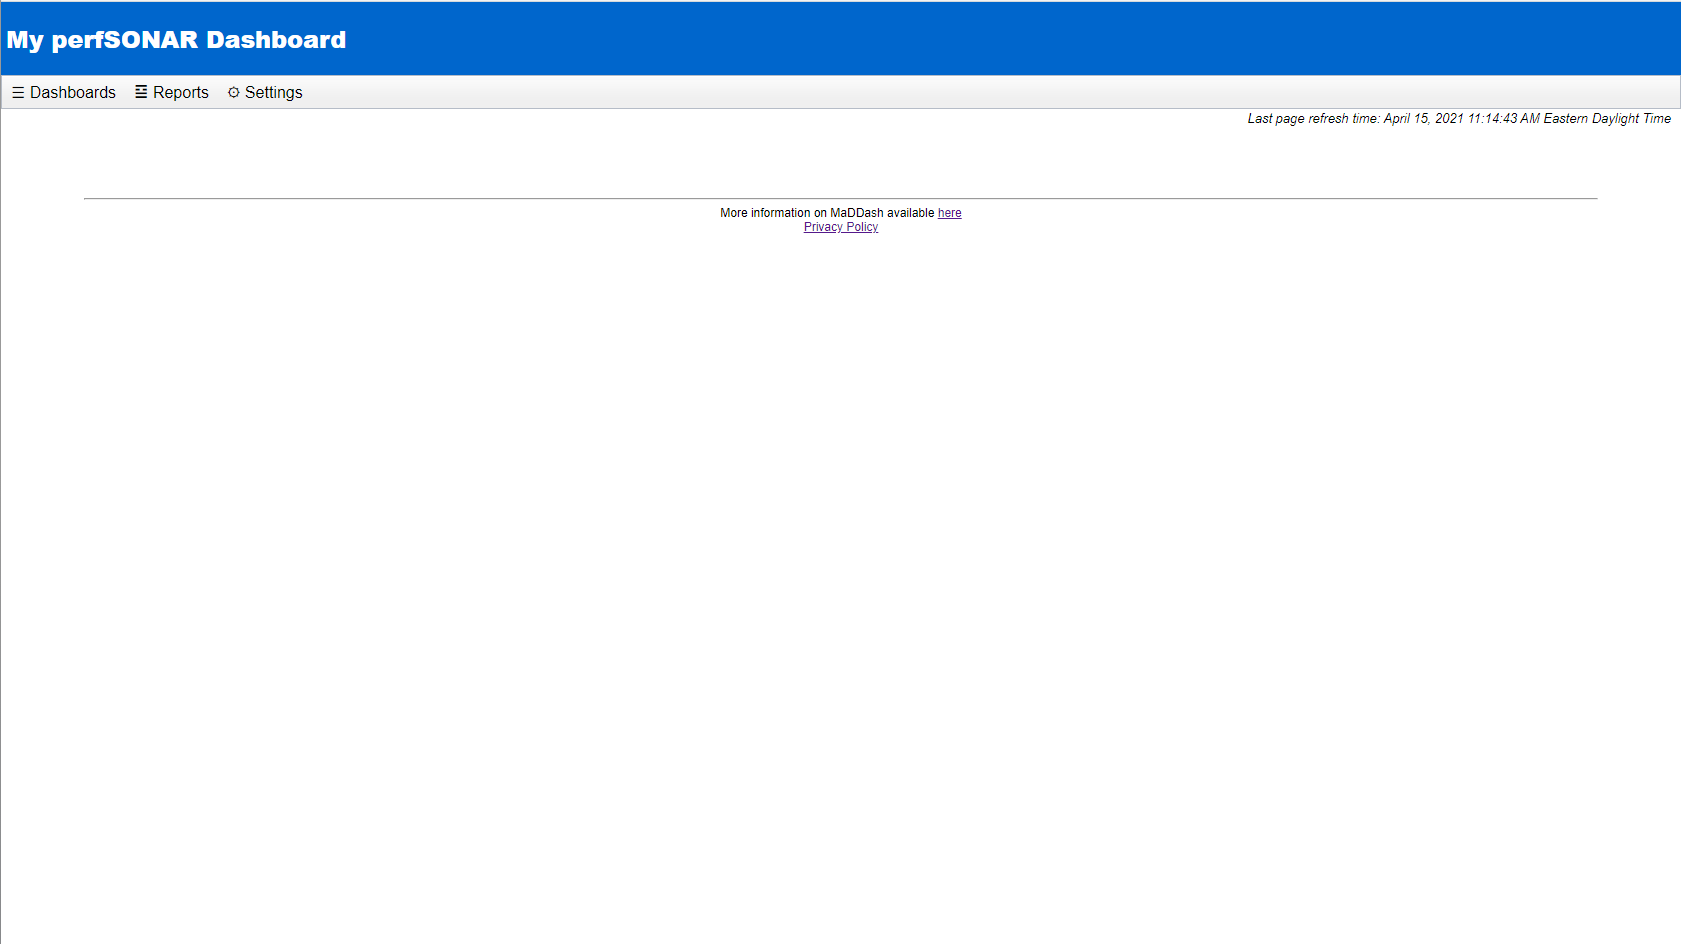
Configuring the Dashboard
When first created, MaDDash has no dashboards setup. To set this up, you need to create a configuration file that details the tests you want to perform and on which perfSONAR nodes you want to run them.
MaDDash Server Configuration
- Create a configuration file.
a. There is a template of these kinds of files in /usr/share/doc/perfsonar/psconfig/skeleton.json
b. To use the template below; edit the following fields
i. Under the “archives” section, replaceFILL_IN_ESMOND_HOSTNAME_OR_IPwith the MaDDash server’s hostname/IP address
ii. Under the “addresses” section, replace the itemsFILL_IN_HOSTNAME_OR_IP_Xwith the hostname/IP address of one of the perfSONAR nodes you wish to include in your MaDDash grids.
iii. Under the “addresses” section, similarly replace the itemsFILL_IN_ADDRESS_NAME_1with a name for the perfSONAR nodes. This name is what will be shown in MaDDash. This should be the hostname of the perfSONAR node preferably, but in principle, any name will work.
iv. To add more nodes to this MaDDash, add another"FILL_IN_ADDRESS_NAME_X": { "address": "FILL_IN_HOSTNAME_OR_IP_X" }and fill in accordingly.
c. Use the following command to verify validity
i. it will print an error message if the file is not formatted correctly or the JSON file if it is.
jq . FILE.json
{
    "_meta":{
        "display-name": "Example Measurements"
    },

    "archives": {
        "example_esmond_archive": {
            "archiver": "esmond",
            "data": {
                "measurement-agent": "{% scheduled_by_address %}",
                "url": "https://FILL_IN_ESMOND_HOSTNAME_OR_IP/esmond/perfsonar/archive/"
            }
        }
    },

    "addresses": {
        "FILL_IN_ADDRESS_NAME_1": { "address": "FILL_IN_HOSTNAME_OR_IP_1" },
        "FILL_IN_ADDRESS_NAME_2": { "address": "FILL_IN_HOSTNAME_OR_IP_2" }
    },

    "groups": {
        "example_group_mesh": {
            "type": "mesh",
            "addresses": [
                { "name": "FILL_IN_ADDRESS_NAME_1" },
                { "name": "FILL_IN_ADDRESS_NAME_2" }
            ]
        }
    },

    "tests": {
        "example_test_throughput": {
            "type": "throughput",
            "spec": {
                "source": "{% address[0] %}",
                "dest": "{% address[1] %}",
                "duration": "PT30S"
            }
        },
        "example_test_latencybg": {
            "type": "latencybg",
            "spec": {
                "source": "{% address[0] %}",
                "dest": "{% address[1] %}",
                "flip": "{% flip %}"
            }
        },
        "example_test_trace": {
            "type": "trace",
            "spec": {
                "source": "{% address[0] %}",
                "dest": "{% address[1] %}"
            }
        }
    },

    "schedules": {
        "example_schedule_PT4H": {
            "repeat": "PT4H",
            "sliprand": true,
            "slip": "PT4H"
        },
        "example_schedule_PT10M": {
            "repeat": "PT10M",
            "sliprand": true,
            "slip": "PT10M"
        }
    },

    "tasks": {
        "example_task_throughput": {
            "group": "example_group_mesh",
            "test": "example_test_throughput",
            "schedule": "example_schedule_PT4H",
            "archives": [ "example_esmond_archive" ],
            "_meta": {
                "display-name": "Example Throughput Tests"
            }
        },
        "example_task_latencybg": {
            "group": "example_group_mesh",
            "test": "example_test_latencybg",
            "archives": [ "example_esmond_archive" ],
            "_meta": {
                "display-name": "Example Loss Tests"
            }
        },
        "example_task_trace": {
            "group": "example_group_mesh",
            "test": "example_test_trace",
            "schedule": "example_schedule_PT10M",
            "archives": [ "example_esmond_archive" ],
            "_meta": {
                "display-name": "Example Traceroute Tests"
            }
        }
    }
}
- Once you have the config file, run the following command to make the file publicly viewable.
sudo psconfig publish /PATH/TO/CONFIG_FILE.json
- Run the following command to allow esmond (the service which handles storing and receiving measurement results) to accept data coming from the nodes you added into the configuration file.
sudo esmond_manage add_user_ip_address test_user 192.168.0.1
a. Substitute the last two values with the username and IP address you want to use, respectively
b. The username can be any name you want; it’s only relevant to esmond.
c. You need to have every IP address in the configuration file added to esmond with this command in order to get all of their test results.
4. Run the following command to let the MaDDash server know about the tests and grids it needs to set up.
sudo psconfig remote add https://192.168.1.1/psconfig/CONFIG_FILE.json
a. Substitute the IP address in the URL with the hostname or IP address of the MaDDash server
5. Restart certain services to make sure the changes from the previous step take effect.
a. cassandra
b. maddash-server
c. psconfig-maddash-agent
perfSONAR node Configuration
To collect data from other nodes, each node needs to join it by running the following commands.
- You will need to contact the administrators of these nodes if you do not have direct access to them yourself.
sudo psconfig remote add --configure-archives http://192.168.1.1/psconfig/CONFIG_FILE.json
sudo systemctl restart psconfig-pscheduler-agent
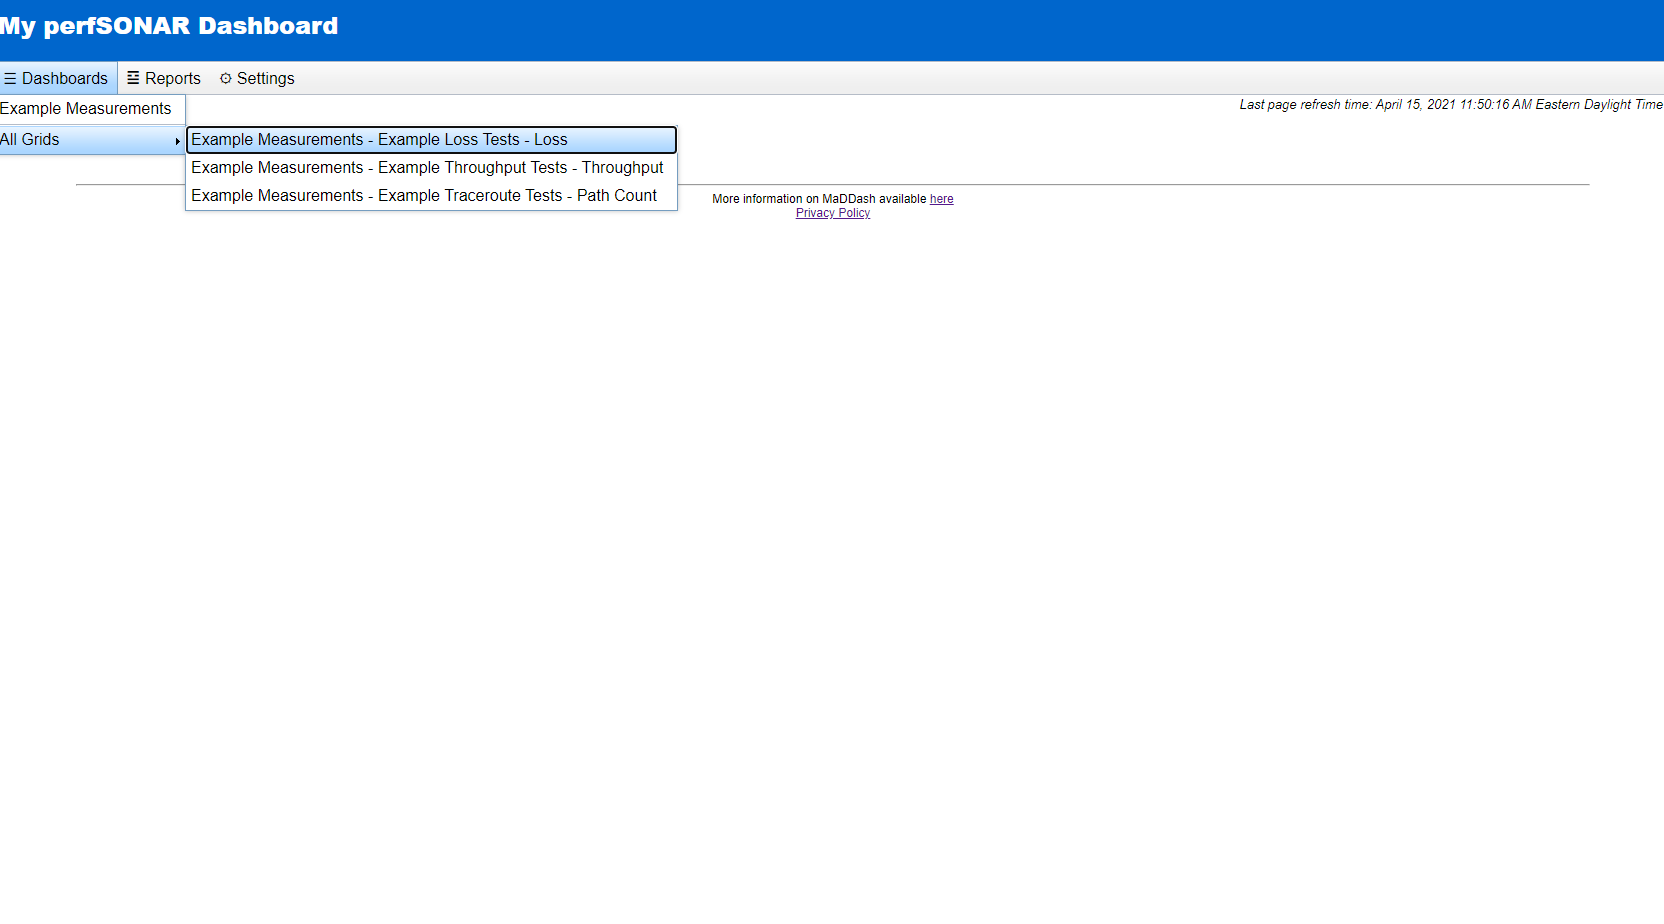
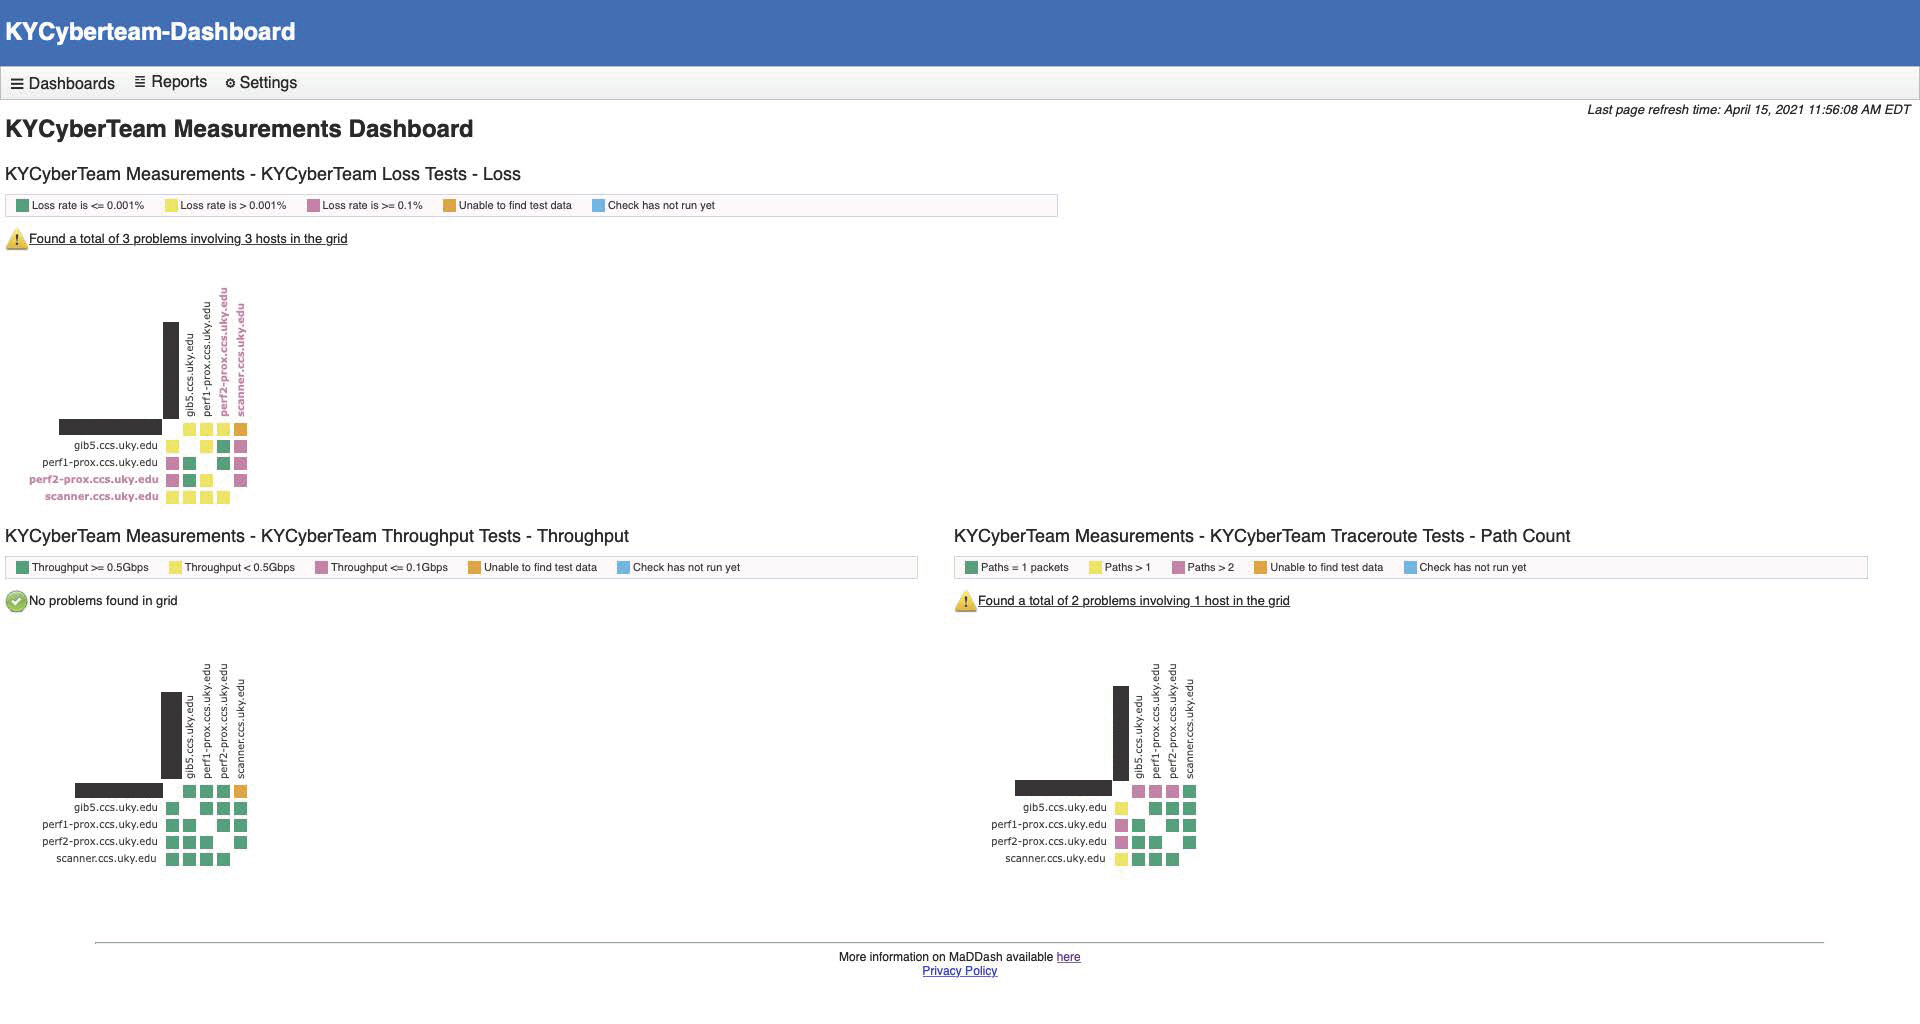
You should be able to go onto the MaDDash web UI and under “Dashboard” in the top-left corner you should see the new dashboard and grids created.
For more information, visit the links below:
What is MaDDash: What is MaDDash? — perfSONAR Toolkit 4.4.4 documentation
MaDDash Installation: MaDDash Installation — perfSONAR Toolkit 4.4.4 documentation
Configure the MaDDash Server: Configuring the MaDDash Server — perfSONAR Toolkit 4.4.4 documentation
For updating PerfSONAR: Updating perfSONAR — perfSONAR Toolkit 4.4.4 documentation